
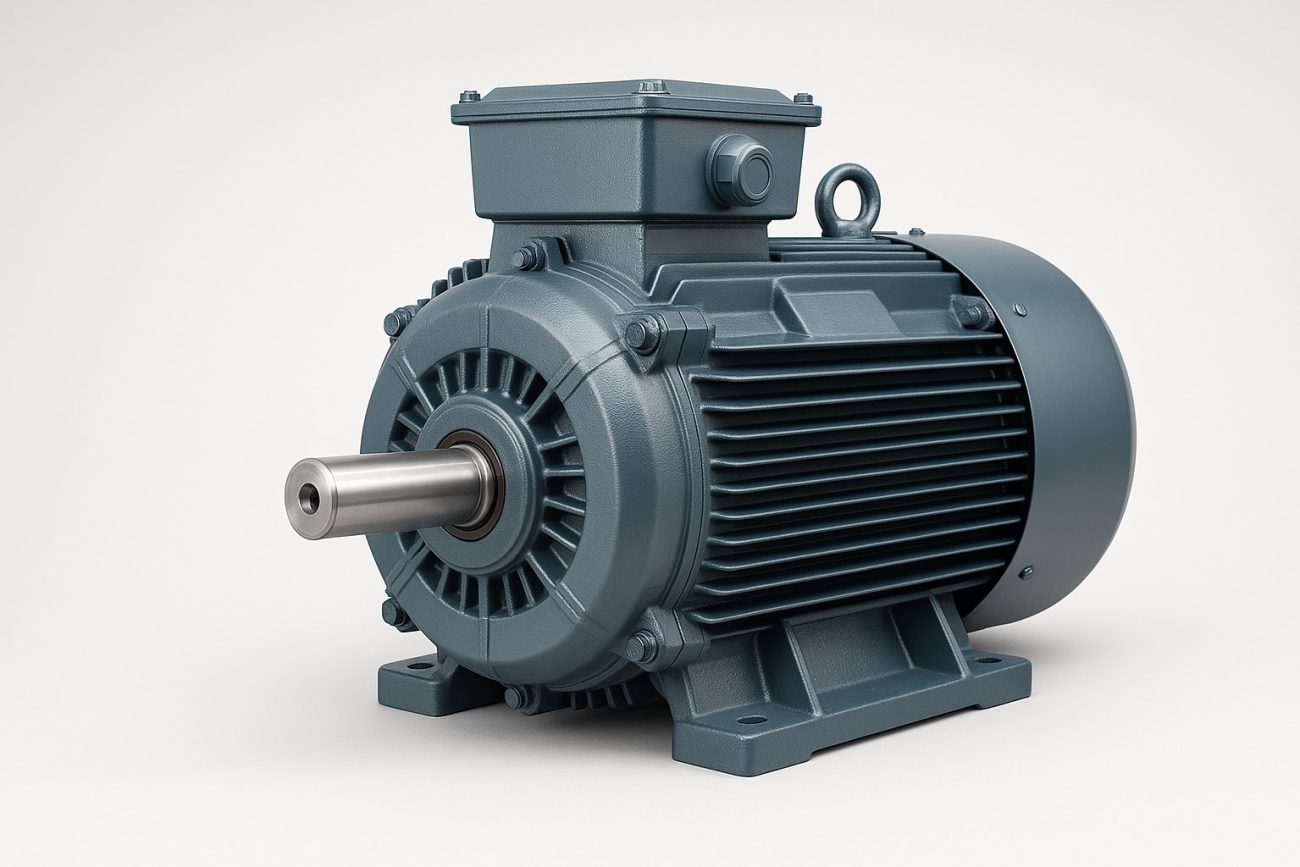
High efficiency motors often make financial sense on pumps with long operating hours. The problem is that the extra purchase cost is visible immediately, while the electricity saving arrives a little at a time over several years.
That makes motor replacement decisions easy to judge on purchase price and difficult to judge on total cost.
When a motor fails, the immediate priorities are usually getting the pump running again, finding a suitable replacement and controlling the repair cost. Those are reasonable priorities. But on a pump that operates for thousands of hours each year, the motor purchase price can become a relatively small part of what that motor costs to own.
The useful comparison is therefore not:
Which motor costs less to buy?
It is:
What will each motor cost to buy and operate over the period we expect to use it?
That calculation does not need to be complicated.
Why motor purchase price can be misleading
An electric motor converts electrical input power into mechanical output power at the shaft.
Motor efficiency describes how much of the electrical input becomes useful mechanical output.
For example, a motor with an efficiency of 94% converts 94% of its electrical input into mechanical output under the stated operating condition. The remaining energy is lost, mainly as heat.
A motor with higher efficiency needs less electrical input to produce the same shaft output.
The difference may look small when comparing two efficiency figures. A change from 93% to 95%, for example, is only two percentage points.
But motors consume electricity hour after hour.
If a pump runs continuously, even a relatively small reduction in input power accumulates across thousands of operating hours each year.
That is why operating hours matter so much to the calculation.
The four numbers you need
Before comparing motors on lifecycle cost, collect four pieces of information:
- Motor shaft power required at the operating condition
- Efficiency of each motor being compared
- Annual operating hours
- Electricity cost per kilowatt-hour
You will also need the purchase price difference between the motors if you want to calculate simple payback.
These values turn a general discussion about efficiency into a financial comparison.
How efficiency affects electrical input power
Motor efficiency can be expressed as:
Efficiency = mechanical output power ÷ electrical input power
Rearranging the equation gives:
Electrical input power = mechanical output power ÷ efficiency
Efficiency must be entered as a decimal in the calculation.
For example, assume a pump requires 30 kW of mechanical power from its motor.
With a motor operating at 93% efficiency:
Electrical input = 30 ÷ 0.93
Electrical input = 32.26 kW
With a motor operating at 95% efficiency:
Electrical input = 30 ÷ 0.95
Electrical input = 31.58 kW
The difference is approximately:
32.26 – 31.58 = 0.68 kW
That 0.68 kW is the power saving whenever the motor operates at that condition.
On its own, the figure may not appear significant.
Operating hours change the picture.
Worked example: a continuously operated pump
Consider a pump with the following assumed duty:
| Item | Motor A | Motor B |
|---|---|---|
| Required shaft power | 30 kW | 30 kW |
| Motor efficiency | 93% | 95% |
| Electrical input | 32.26 kW | 31.58 kW |
| Annual operating hours | 8,000 h | 8,000 h |
| Electricity rate | $0.20/kWh | $0.20/kWh |
The annual electrical energy consumption is:
Motor A:
32.26 kW × 8,000 h = 258,080 kWh/year
Motor B:
31.58 kW × 8,000 h = 252,640 kWh/year
The difference is approximately:
5,440 kWh/year
At an electricity rate of $0.20/kWh:
5,440 × $0.20 = $1,088 per year
Under these assumptions, the higher efficiency motor saves about $1,088 in electricity each year.
If it costs an additional $1,500 to purchase, the simple payback would be:
$1,500 ÷ $1,088 = approximately 1.4 years
After that point, the energy saving continues for as long as the operating conditions and electricity cost remain broadly similar.
This is an illustrative calculation rather than a universal result. Change the motor size, efficiency, running hours or electricity price and the payback changes with it.
That is exactly why site-specific numbers matter.
Operating hours often determine whether the upgrade works
The same motor can produce a very different financial result depending on how often the pump runs.
Using the previous example, the power saving was approximately 0.68 kW.
At 8,000 operating hours per year, the annual energy saving is about 5,440 kWh.
At 2,000 hours per year, it falls to about 1,360 kWh.
At 500 hours per year, it falls to about 340 kWh.
With electricity priced at $0.20/kWh, those approximate annual savings become:
| Annual operating hours | Energy saved | Cost saved |
|---|---|---|
| 8,000 h | 5,440 kWh | $1,088 |
| 2,000 h | 1,360 kWh | $272 |
| 500 h | 340 kWh | $68 |
This is why a motor efficiency upgrade that makes sense on a continuously operated process pump may have weak financial justification on an emergency standby pump.
The efficiency improvement is the same. The opportunity to benefit from it is not.
Electricity price has the same effect
The value of each kilowatt-hour saved depends on what the site pays for electricity.
If electricity costs rise, the financial value of the efficiency improvement rises with it.
Using the same 5,440 kWh annual energy saving:
- At $0.10/kWh, the saving is $544/year.
- At $0.20/kWh, the saving is $1,088/year.
- At $0.30/kWh, the saving is $1,632/year.
A lifecycle calculation should therefore use the site’s real electricity rate where possible.
For sites with more complex tariffs, the calculation may require more detail than a single $/kWh figure. Demand charges, time-of-use pricing and operating schedules can affect the result.
For an initial comparison, however, annual energy consumption multiplied by the site’s effective electricity cost provides a useful starting point.
Simple payback is useful, but it is not the whole lifecycle calculation
Simple payback answers a straightforward question:
How long will the energy saving take to recover the additional purchase cost?
The equation is:
Payback period = additional purchase cost ÷ annual energy cost saving
It is useful because maintenance, engineering and procurement teams can understand it quickly.
But payback does not describe every cost associated with a motor.
A fuller lifecycle assessment may also consider:
- expected operating life
- maintenance costs
- motor loading
- electricity price changes
- downtime consequences
- repair versus replacement strategy
- the time value of money
For many routine replacement decisions, a simple energy and payback calculation is enough to establish whether a closer lifecycle review is worthwhile.
Use actual motor loading where possible
One mistake is to assume the motor always operates at its nameplate power.
It may not.
A 45 kW motor driving a pump does not automatically deliver 45 kW continuously. The actual shaft power depends on the pump duty and system operating point.
Motor efficiency can also change with load.
For a more useful calculation, base the comparison on the motor’s expected operating load and the efficiency at that load where reliable data are available.
Measured electrical input can provide an even better starting point when assessing an existing installation, provided the measurement accurately represents normal operation.
The purpose is not to make the calculation more complicated than necessary. It is to avoid building a precise-looking payback figure from unrealistic assumptions.
Motor efficiency is only one part of pump system efficiency
A higher efficiency motor reduces electrical losses in the motor.
It does not correct an inefficient pump system.
A pump operating far from its intended duty point, throttling away excessive pressure or circulating unnecessary flow may waste considerably more energy than can be recovered through a motor efficiency upgrade alone.
That does not make motor efficiency unimportant.
It means the motor should be considered as part of the complete pump system.
When energy use is high, look at:
- the actual pump duty
- pump efficiency at the operating point
- throttling losses
- bypass or recirculation flow
- control method
- system resistance
- operating hours
- motor efficiency
Changing the motor can reduce one source of loss. Correcting the operating duty can sometimes address another.
The replacement decision needs numbers
When a failed motor is sitting on the workshop floor, purchase price is easy to see.
Energy cost is not.
That is the main reason efficiency upgrades can be difficult to justify without a calculation.
The answer is not to assume that the most efficient motor is always the correct financial choice. Nor is it to choose the lowest purchase price automatically.
Calculate the difference.
For pumps with low annual operating hours, the energy saving may never recover a large price premium within the expected service period.
For pumps that operate for thousands of hours each year, the result can be very different.
Once purchase cost, motor efficiency, operating hours and electricity price are placed side by side, the discussion changes from:
“This motor costs more.”
to:
“What will this motor cost us to operate?”
That is the comparison that matters over the life of the equipment.
Key takeaways
- Motor purchase price is only one part of the cost of owning and operating a pump motor.
- Higher motor efficiency reduces the electrical input required for the same mechanical output.
- Annual operating hours have a major influence on the value of an efficiency upgrade.
- Use actual motor load, efficiency and electricity costs where possible rather than relying only on nameplate ratings.
- Simple payback can show whether the additional purchase cost is likely to be recovered through lower electricity consumption.
- Evaluate motor efficiency alongside the efficiency of the complete pump system.
About The Pump Expert
The Pump Expert provides independent, practical education for pump users, engineers and maintenance teams. TPE explains how pumps and pump systems behave so readers can make better technical decisions without supplier bias.
